NoteChart and EasyNoteChart
Overview
The NoteChart module extends Ignition's built-in Classic Chart and Easy Chart to mark the plot with a witness line and text at the location of specific time-stamped events.
As of version 2.0, an alternative to the Reporting Module's Timeseries Chart is available to produce printable charts with timestamped annotations. See the Reporting section below. The ReportNoteChart component may be used even if the Vision module is not installed.
Features
- Translucent Text
The text of each note is drawn with a partially transparent background, leaving plot lines and other data visible underneath, but preserving text contrast.
- Auto X-Trace
Each annotation element is selectable (at its text), triggering X-Trace display of plot values at the note's timestamp.
The X-Trace mode itself is altered:
- Data values and the timestamp are drawn with translucent text and partially transparent background,
- Data values are displayed with the number display format from the data's axis,
- X-Axis timestamps are displayed with a user-supplied format selected for the zoom level,
- The selected trace timestamp and the closest sample values are available as a Date property and a Dataset, and
- Both Annotation selection and Independent X-Trace can be triggered by assigning to the appropriate properties.
- Both timestamp and pen values to display may be replaced with user-supplied strings via extension functions. Can be used to implement differential value displays.
- Tooltips
Each note may be supplied with explanatory text that will be displayed when the mouse hovers over that note's primary text.
- Prioritized display
Each note may be assigned a numeric priority for use when many notes fall within the plot's timescale. Notes with negative or missing priority are always displayed. After those are counted, the remaining notes are grouped by priority, and added to the display list in ascending priority order. If adding the notes in a given priority would exceed the Priority Threshold, that group and all remaining are hidden.
Prioritization is computed after any zoom and pan operations have limited the visible annotations. As the user zooms in, more annotations can pop into view.
- Jointed trace witness lines
When multiple notes have closely-spaced timestamps such that their text would overlap, the text positions are shifted and diagonals added to the witness lines.
- Auto font scaling
After prioritization, given the requested font size, the list of notes to display could overflow the available space. The font is then automatically shrunk to fit all of the notes without overlap.
The same rescaling algorithm is applied to X-Trace data values when many series are present in a plot or subplot.
- Support for EasyNoteChart DB Pen Caching
When installed together with the Time Series Database Cache Module, the EasyNoteChart's Database Pens will be drawn from the cache by default. When the EasyNoteChart's date range selector is visible, histogram generation will also preload the cache with the outer timespan.
- Mouse Event Domain Timestamps
All mouse events (other than the mouse wheel) have been enhanced to include a domainTS property of type java.util.Date that corresponds to the x,y coordinates in the event. This property can be None if there's no data displayed.
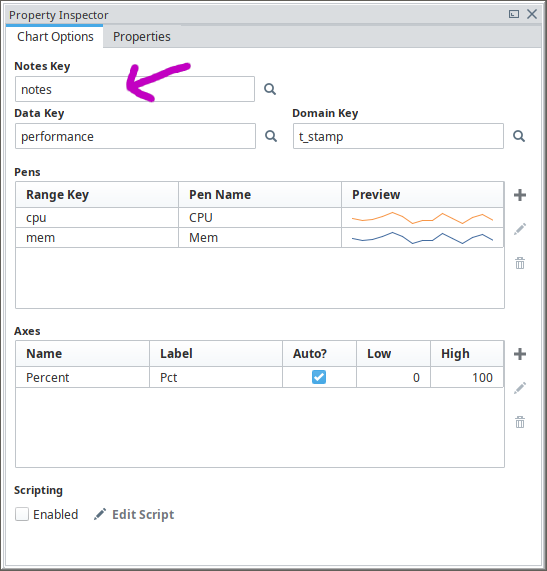
Configuration
The NoteChart and EasyNoteChart components for Vision accept two datasets containing annotations to display, a primary and an alternate. Although all features are available in both datasets, the primary dataset 'notes' is expected to contain prioritized annotations from a suitable database of events, where the alternate dataset 'altNotes' is expected to contain one or more unprioritized annotations supplied by your gui. (Such as user-entered annotations that haven't been saved to your database yet.)
Each annotation dataset must supply 't_stamp' and 'text' columns, and may optionally supply 'priority', 'tooltip', and/or 'color' for each annotation. For best performance, database bindings should use a WHERE clause to restrict the time span to the same as the plot, and should use ORDER BY t_stamp.
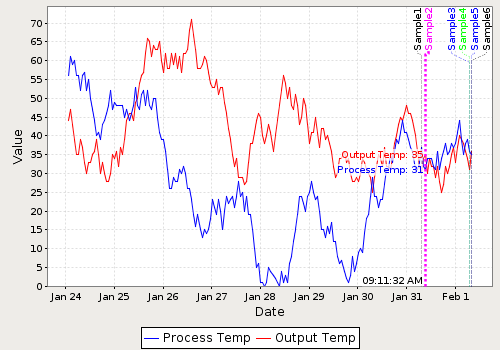
| t_stamp | text | priority | tooltip | color |
|---|---|---|---|---|
| 2015-01-31 07:11:32 | Sample1 | -1 | Sample Tip #1 | |
| 2015-01-31 09:11:32 | Sample2 | -1 | Sample Tip #2 | |
| 2015-02-01 07:10:32 | Sample3 | -1 | Sample Tip #3 | |
| 2015-02-01 07:11:32 | Sample4 | -1 | Sample Tip #4 | |
| 2015-02-01 08:11:31 | Sample5 | -1 | Sample Tip #5 | |
| 2015-02-01 08:11:32 | Sample6 | -1 | Sample Tip #6 |
As for plot data, the NoteChart component is configured just like the built-in Classic Chart, but must have a range of dates/times as its x-axis, displayed as an XYPlot or a Combined Domain XYPlot.
Similarly, the EasyNoteChart component works like the built-in Easy Chart. Warning: although the EasyNoteChart supports the "showLoading" property, it may cause performance problems when many annotations are displayed.
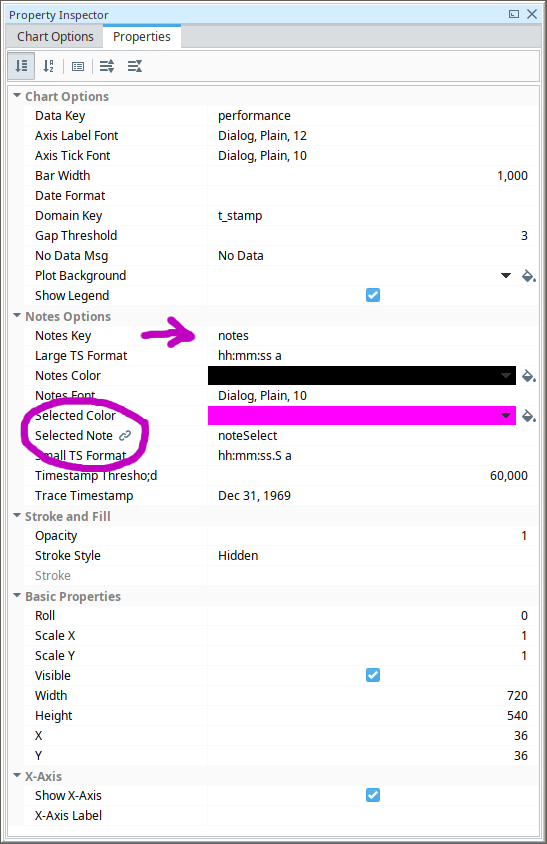
Appearance Properties
| Annotation Font | The font used for annotations and XTrace values. | |
| Script Name | noteFont | |
| Data Type | Font | |
| Annotation Color | The default color used for annotations and their witness lines when no color is supplied in the dataset (or the supplied color is invalid). | |
| Script Name | noteColor | |
| Data Type | Color | |
| Annotation Stroke | The line style and weight used for annotation witness lines. | |
| Script Name | noteStroke | |
| Data Type | Stroke | |
| Selected Annotation Color | When a note is selected for XTrace display, this color is used for the text and witness line. | |
| Script Name | selNoteColor | |
| Data Type | Color | |
| Selected Annotation Stroke | When a note is selected for XTrace display, this line style and weight is used for the witness line. | |
| Script Name | selNoteStroke | |
| Data Type | Stroke | |
| X-Trace Large Timestamp Format | Format for the X-Trace Timestamp when the X-Axis is zoomed out wider than the Threshold. | |
| Script Name | xTraceLargeTSFormat | |
| Data Type | String | |
| X-Trace Small Timestamp Format | Format for the X-Trace Timestamp when the X-Axis is zoomed in narrower than the Threshold. | |
| Script Name | xTraceSmallTSFormat | |
| Data Type | String | |
Behavior Properties
| Priority Threshold | The limit on the number of notes to display at once, before triggering priority filtering. | |
| Script Name | prioThreshold | |
| Data Type | Integer | |
| X-Trace Timestamp Format Threshold | X-Axis Span that switches the timestamp format to use, in milliseconds. | |
| Script Name | xTraceTSFormatThreshold | |
| Data Type | Long | |
| Enable Note Selection | When checked, mouse clicks on the text of an annotation will trigger XTrace display for that note. And clicks away from a note will deselect any note. The selectedNote, selectedAltNote, and traceTS properties are updated accordingly. | |
| Script Name | enableNoteSelect | |
| Data Type | Boolean | |
| Enable Time Series Cache | When checked, and the Time Series Database Cache Module is present, Database Pens will use the Time Series Cache instead of direct queries. (Applies to the EasyNoteChart component only.) Adjust query timing parameters through the Gateway Configuration Interface under Databases, Time Series Caching. | |
| Script Name | enableTSCache | |
| Data Type | Boolean | |
Data Properties
| Notes | The primary dataset of annotations to display. When written to while a primary note is selected, the new dataset will be searched for a matching note. If found, it will be selected. | |
| Script Name | notes | |
| Data Type | Dataset | |
| Alternate Notes | The alternate dataset of annotations to display. When written to while an alternate note is selected, the new dataset will be searched for a matching note. If found, it will be selected. | |
| Script Name | altNotes | |
| Data Type | Dataset | |
| Trace Timestamp | The timestamp of the selected note, or of the unselected XTrace. When written to, any selected note is deselected. | |
| Script Name | traceTS | |
| Data Type | Date | |
| Pen Value Samples | Read-only dataset of pen values at the trace timestamp (when visible). | |
| Script Name | samples | |
| Data Type | Dataset | |
| Selected Note | The row number within the primary dataset of the selected note, or -1 otherwise. When written to, selectedAltNote and traceTS are reset/updated as needed. | |
| Script Name | selectedNote | |
| Data Type | Integer | |
| Selected Alternate Note | The row number within the alternate dataset of the selected note, or -1 otherwise. When written to, selectedNote and traceTS are reset/updated as needed. | |
| Script Name | selectedAltNote | |
| Data Type | Integer | |
Extension Methods
formatTraceTS(self, chart, traceTS, textFmt)
Allows overriding the displayed timestamp in X-Trace mode. Return the string or None for the default.
| Argument | Data Type | Description |
|---|---|---|
| self | NoteChart or EasyNoteChart | Calling Component. |
| chart | JFreeChart | Refer to the JFreeChart documentation for API details. |
| traceTS | Date | The timestamp to format. |
| textFmt | String | A string with the date formatting pattern that would be used by default. |
formatTraceValue(self, chart, subPlot, plotDS, penIdx, v, rangeAxis, penName)
Allows overriding the displayed pen name and value in X-Trace mode. Return the string or None for the default.
| Argument | Data Type | Description |
|---|---|---|
| self | NoteChart or EasyNoteChart | Calling Component. |
| chart | JFreeChart | Refer to the JFreeChart documentation for API details. |
| subPlot | Integer | The subplot index within the chart. |
| plotDS | Integer | The plot dataset index within the subplot. |
| penIdx | Integer | The pen index within the plot dataset. |
| v | Double | The (interpolated) pen value to format. |
| rangeAxis | ValueAxis | The axis object that would normally supply the number format. Refer to the JFreeChart documentation for API details. |
| penName | String | The name of the pen. *Not* automatically prepended to your result string. |
Reporting
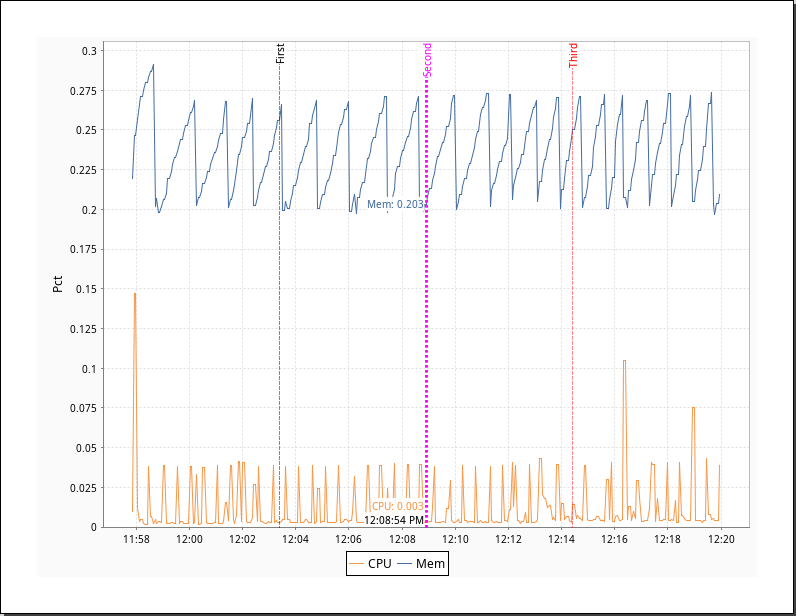
The ReportNoteChart component for the Reporting Module has all of the base functionality of the Timeseries Chart plus accepts a data key containing annotations to display. This key supplies timestamped annotations as described above for the notes dataset property on the Vision components. The datakey must have nested keys (columns) named t_stamp and text. As the reporting module targets static display, any tooltip key is ignored. Keys for priority and color are optional.
As seen in the example above, the component supports a static X-Trace using the Selected Note property of the chart. With the exception of the properties related to the alternate notes dataset, the trace values dataset, and the witness stroke settings, the balance of the properties are as described above.